
Kivema LLC / Consumer goods
A scoreboard connecting spend, sessions, orders and cost.
With Shopify, Amazon and multiple advertising markets, Kivema needed one measurement view that made commercial movement visible without flattening important channel differences.
- Industry
- Consumer goods
- Market
- Germany / United States / Israel
- Period
- 2025-2026
Analytics & tracking
Challenge / 01
What had to change.
The analytics task was to define a shared funnel, verify the signals behind orders and revenue, and turn weekly reporting into concrete decisions about budget, creative and the store.
Website and interface views / 02
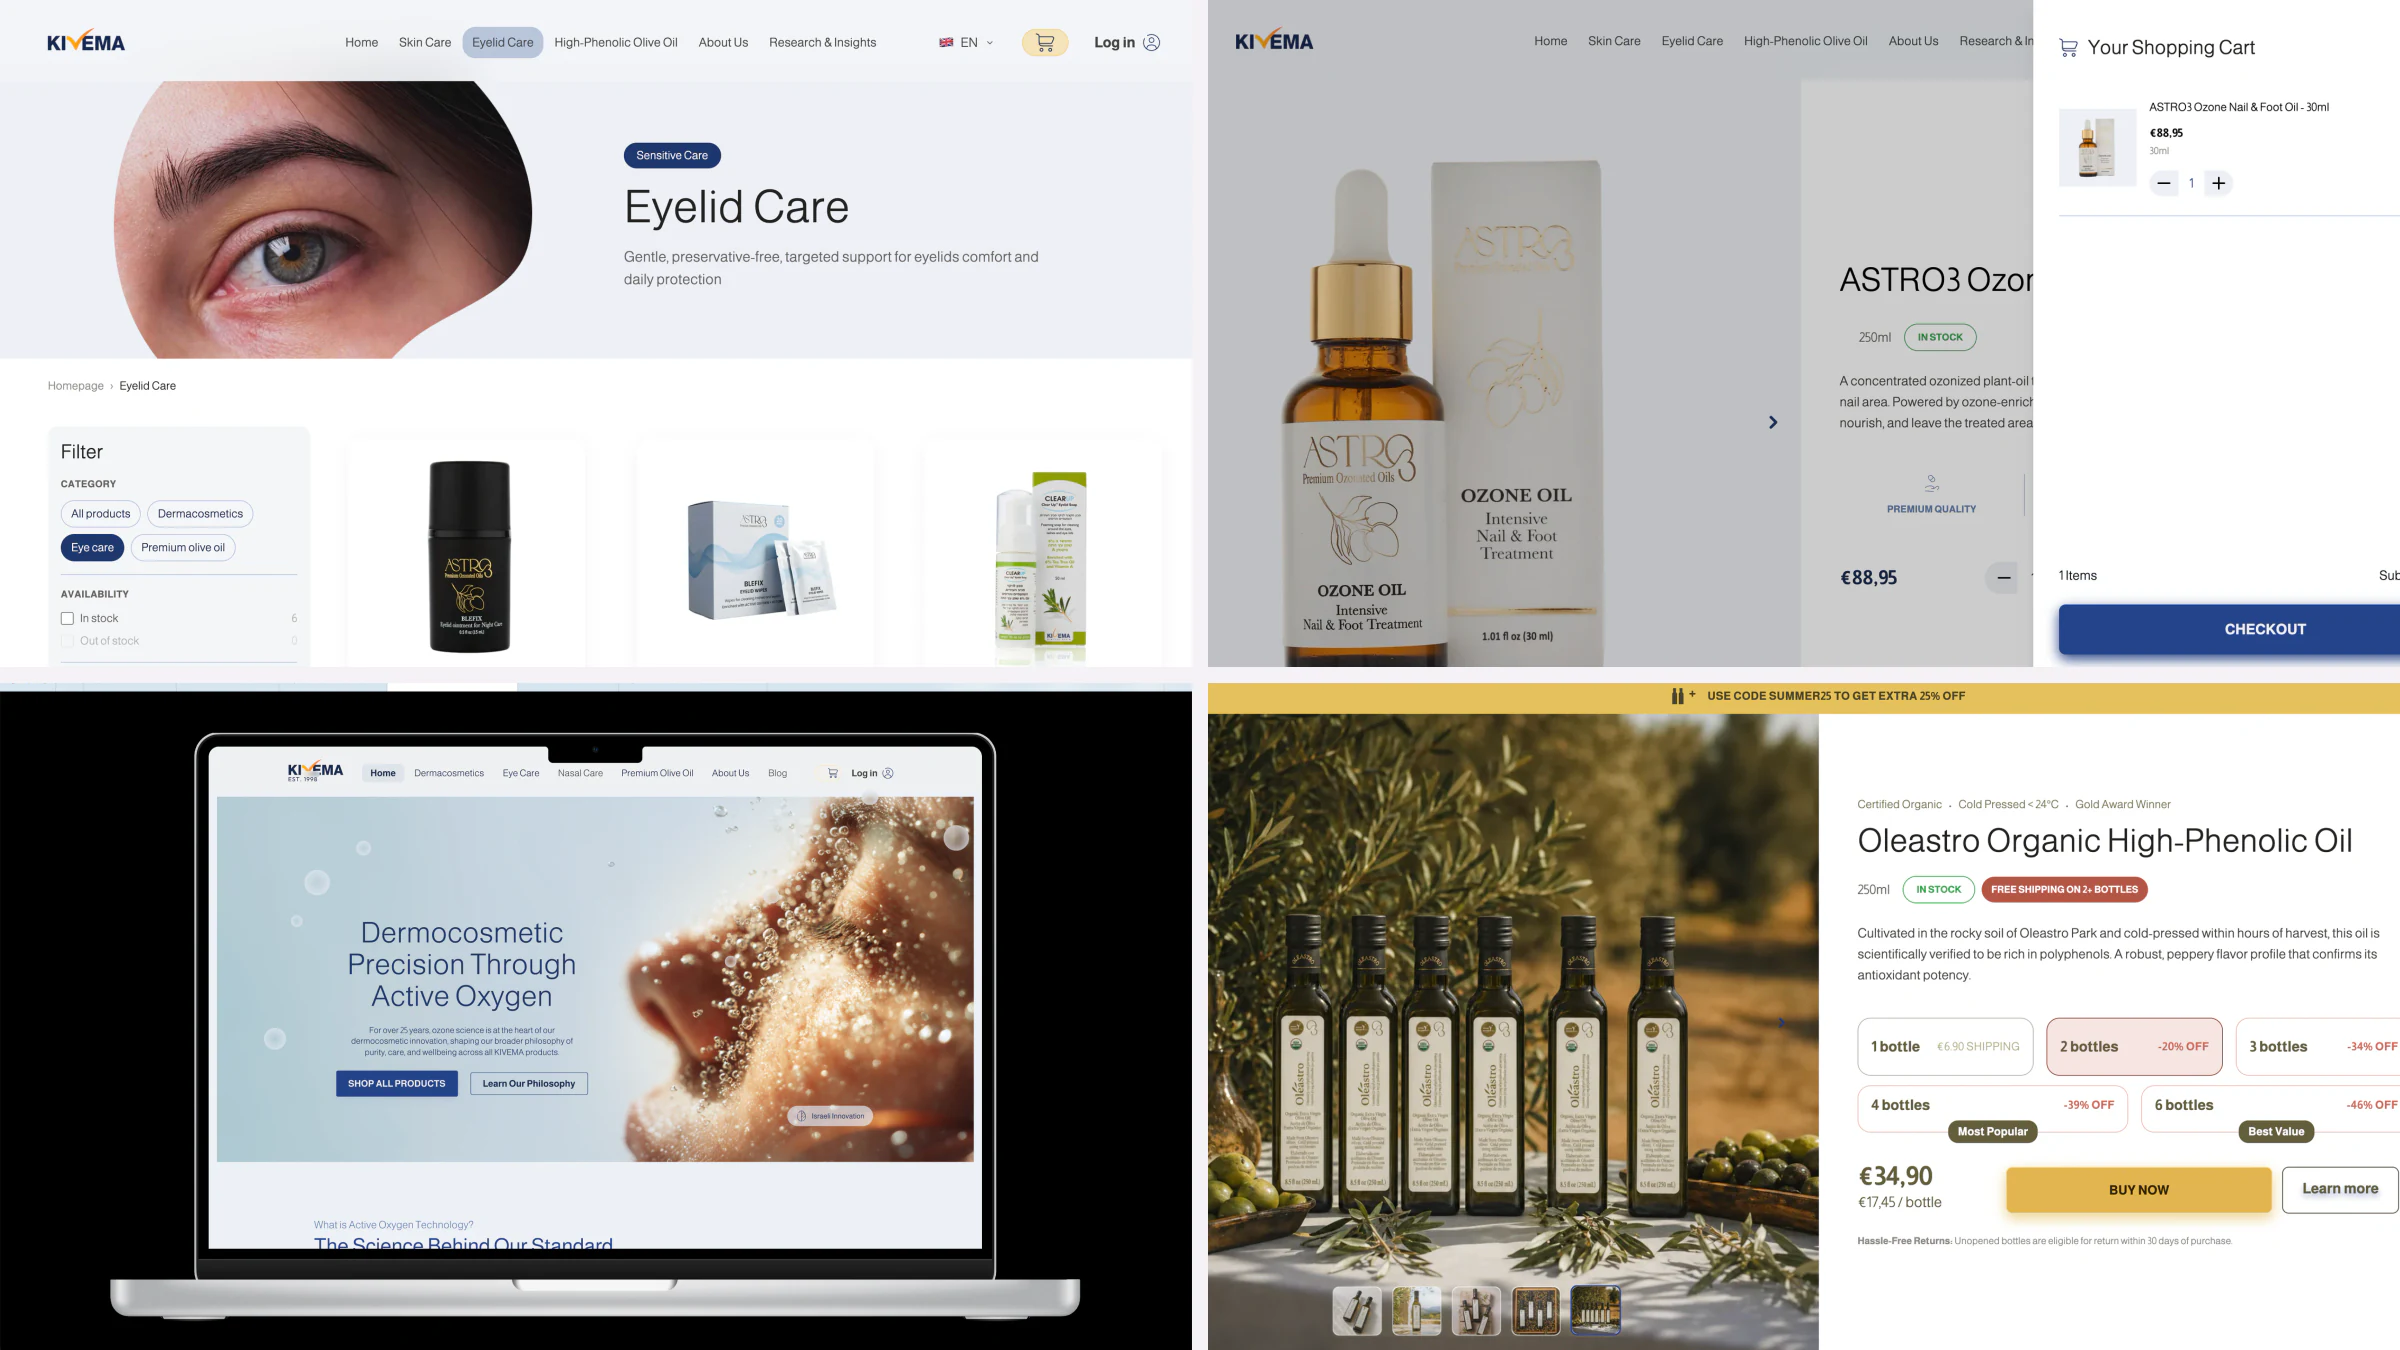
Explore the pages at full scale.
Swipe between high-resolution views. Select any screen to inspect it more closely.
01 / 03
Delivery / 03
How the work was organised.
Scope
Measurement design / GA4, GTM and platform tracking / Decision dashboards / Cross-market commerce dashboard / Funnel and break-even definitions
- 01
Define meaningful signals
Agree the events, conversions and commercial definitions that should drive reporting and optimisation.
- 02
Implement and test
Connect browser, server and advertising-platform signals, then test the full journey for gaps and duplication.
- 03
Turn data into decisions
Build a reporting rhythm that shows what changed, why it matters and what the team should do next.
Outcome / 04
What the system produced.
The weekly scoreboard exposed the recovery clearly: sessions rose 30%, orders 50% and sales 61%, while blended cost per order fell 42% versus the previous week.
- +50%Orders
Relative week-on-week increase in paid orders.
22–28 June 2026 vs previous week - +61%Sales
Relative week-on-week increase in Shopify sales.
22–28 June 2026 vs previous week - -42%Blended cost per order
Relative reduction in blended cost per order across the measured activity.
22–28 June 2026 vs previous week - +30%Sessions
Relative week-on-week increase in store sessions.
22–28 June 2026 vs previous week
Delivered
- Event and conversion map
- Tracking implementation and QA
- Actionable analytics dashboard
- Cross-market commerce dashboard
- Funnel and break-even definitions
- Weekly decision and anomaly reporting
Evidence status
Verified against the Kivema weekly performance brief for 22–28 June 2026. Product statements and award references visible in campaign assets still require separate substantiation and publication approval.